 Tensai Academy
Kinematics
Course Detail
Kinematics
List of Contents
Introduction
Kinematics is the branch of physics that deals with motion.
- Motion is the change in position of an object over time.
- Speed is the rate of motion of an object.
- Uniform motion describes an object moving at a constant speed in a straight line. Uniform motion is almost impossible to maintain, so the term average speed is usually used.
- Origin: Point of reference. For example, starting line, finish line, location of another person, etc.
- Position: The straight-line distance between the origin and an object's location; includes magnitude and direction. For example, how far away from the starting line is a person and in what direction.
- Scalar Quantity: A measurement that has magnitude only. For examples, Speed, distance, etc. She parked her car 3 blocks away, there is no indication of direction.
- Vector Quantity: A measurement that has both magnitude and direction. For example, speed and direction of movement 110 km/h East, 15m North, etc. Please move your car 3 more meters to the right. This shows distance and direction.
Uniform Motion
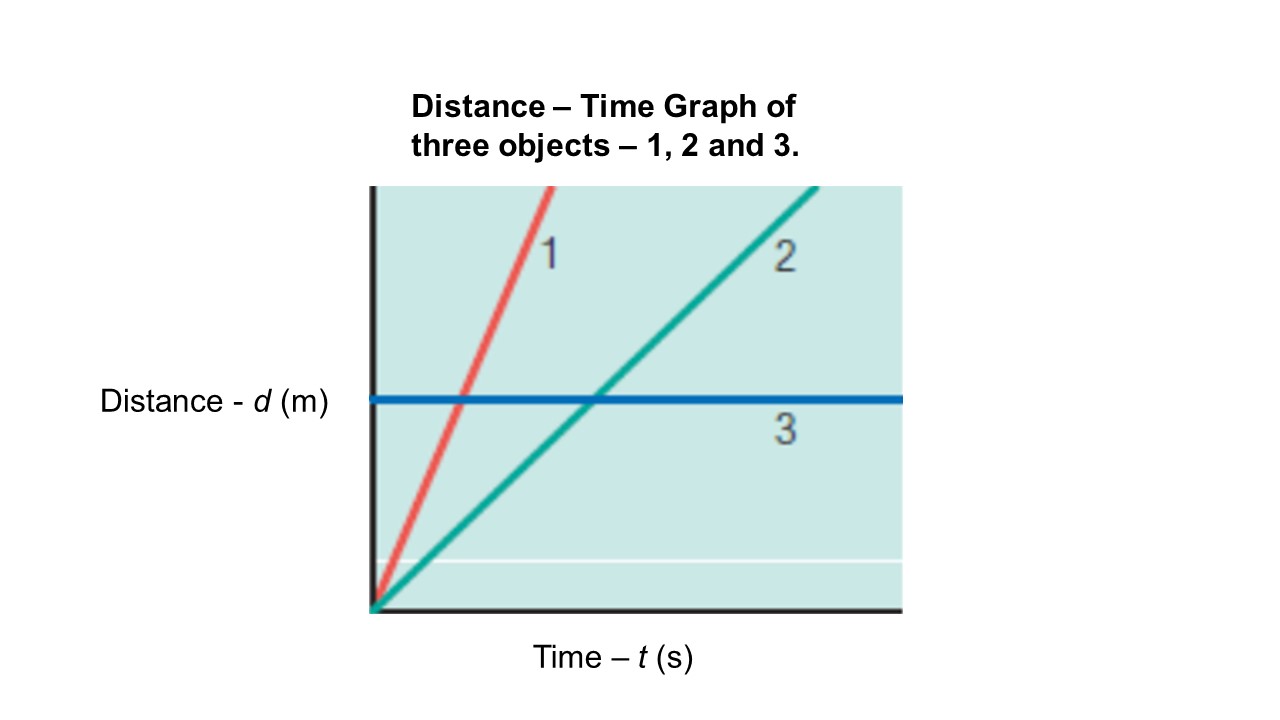
Distance-Time Graphs
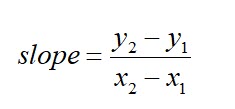
Under uniform motion, the line of best fit of a distance-time graph is represented as a straight line. The slope of any line is equal to the change in vertical direction divided by the change in horizontal direction. The slope of a distance-time graph is equal to the average speed of the object.
Speed -Time Graphs (Uniform Motion)
A speed-time graph showing uniform motion will have a straight, horizontal line of best fit. Total distance traveled is equal to the area under the line.
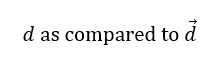
Distance and Displacement
Distance refers to how far an object travels, regardless of direction. Distance is a scalar quantity
Displacement refers to how far an object has moved, regardless of the path travelled. Displacement is a vector quantity.
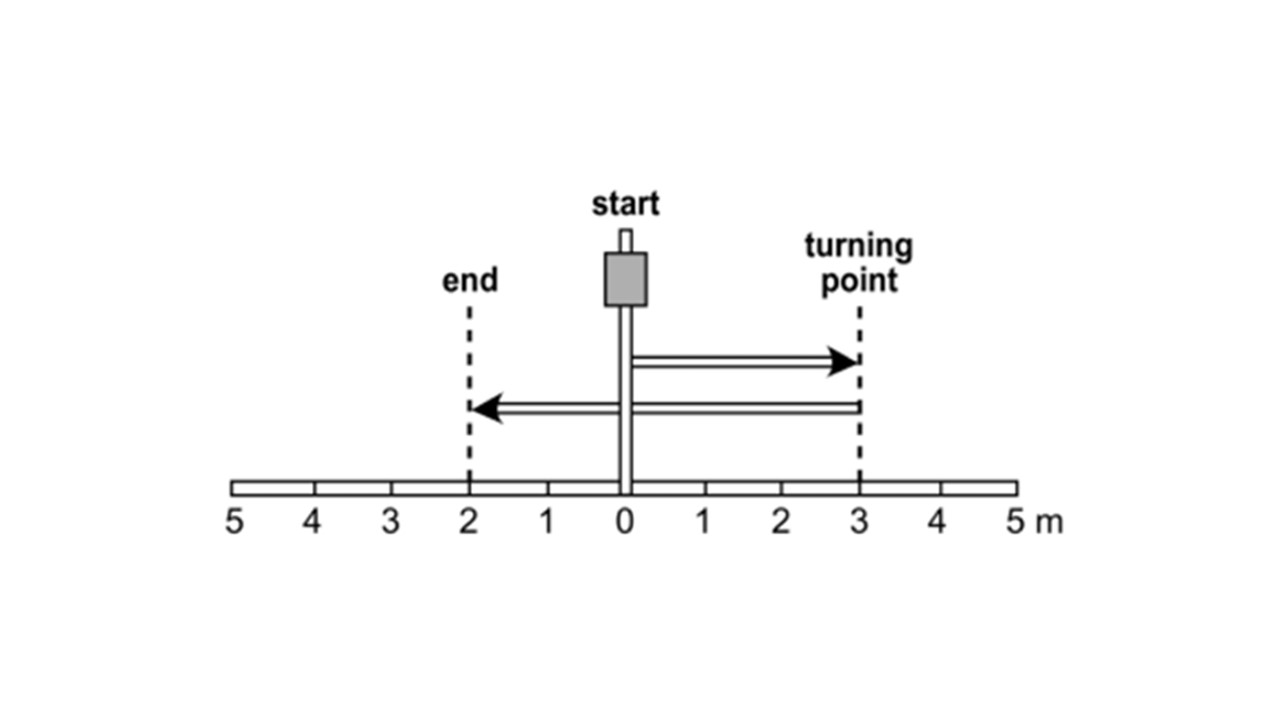
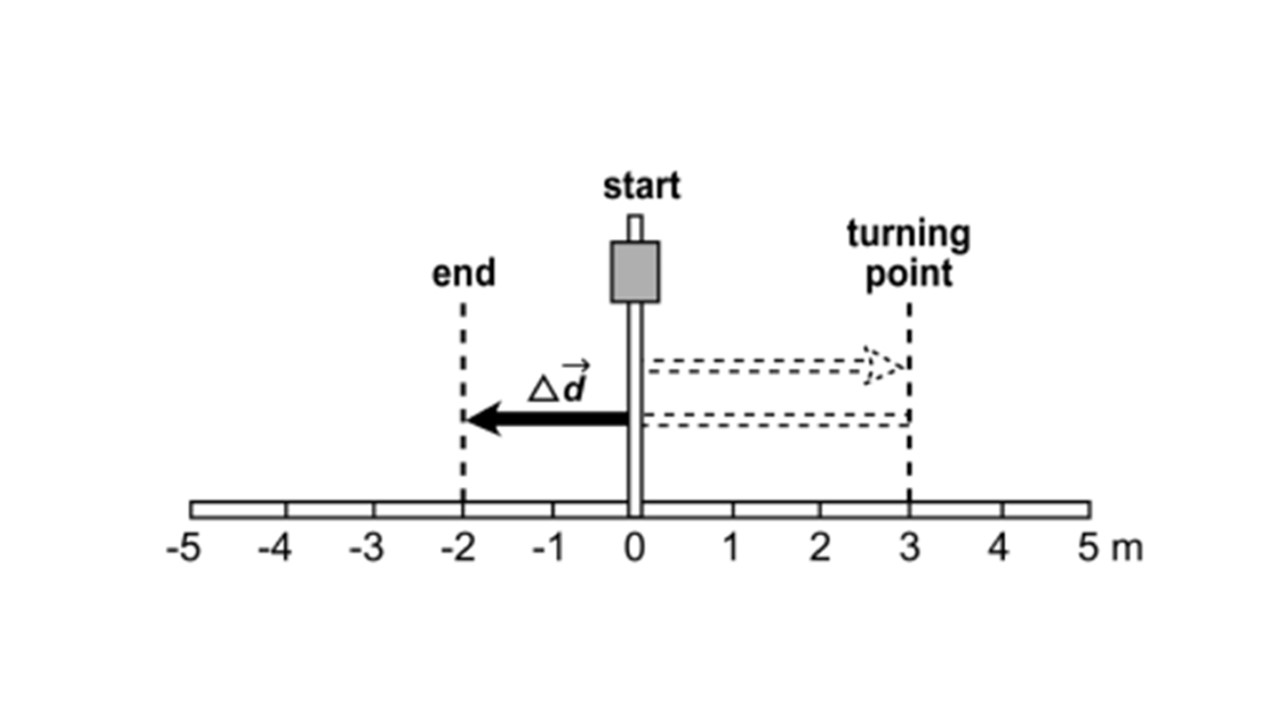
An illustration of distance (left) and displacement (right).
Slope
The slope is a measure of the rate of change. For example, to calculate the slope of a velocity-time graph, select two new points on the line of best fit, read the values for each of the new points and then apply the slope formula as shown below.
Scalar and Vector Quantities
Scalar and Vector quantities are used to describe motion. Vectors can be described using the following conventional signs.
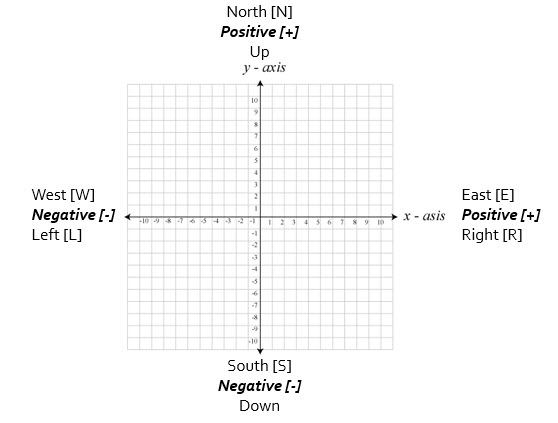
Representing scalar and vector quantities
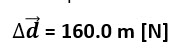
The symbol Δ means 'change' and when combined with 'd' (Δd) it represents a change in distance. A little arrow indicates the quantity also has direction, making it a vector quantity.
Examples
Sprinting drills include running 40.0 m [N], walking 20.0 m [N], and then sprinting 100.0 m [N]. What is the sprinter’s displacement from the initial position?
Velocity
Velocity is the rate at which an object changes its position. Velocity is a vector quantity; speed is a scalar quantity.
Graphical representation of Velocity
The slope of a position-time graph represents the average velocity. A straight line of best fit indicates that the motion is uniform.
A velocity-time graph showing uniform motion will have a straight, horizontal line of best fit. The area under the line of a velocity-time graph is equal to the total displacement of the object.
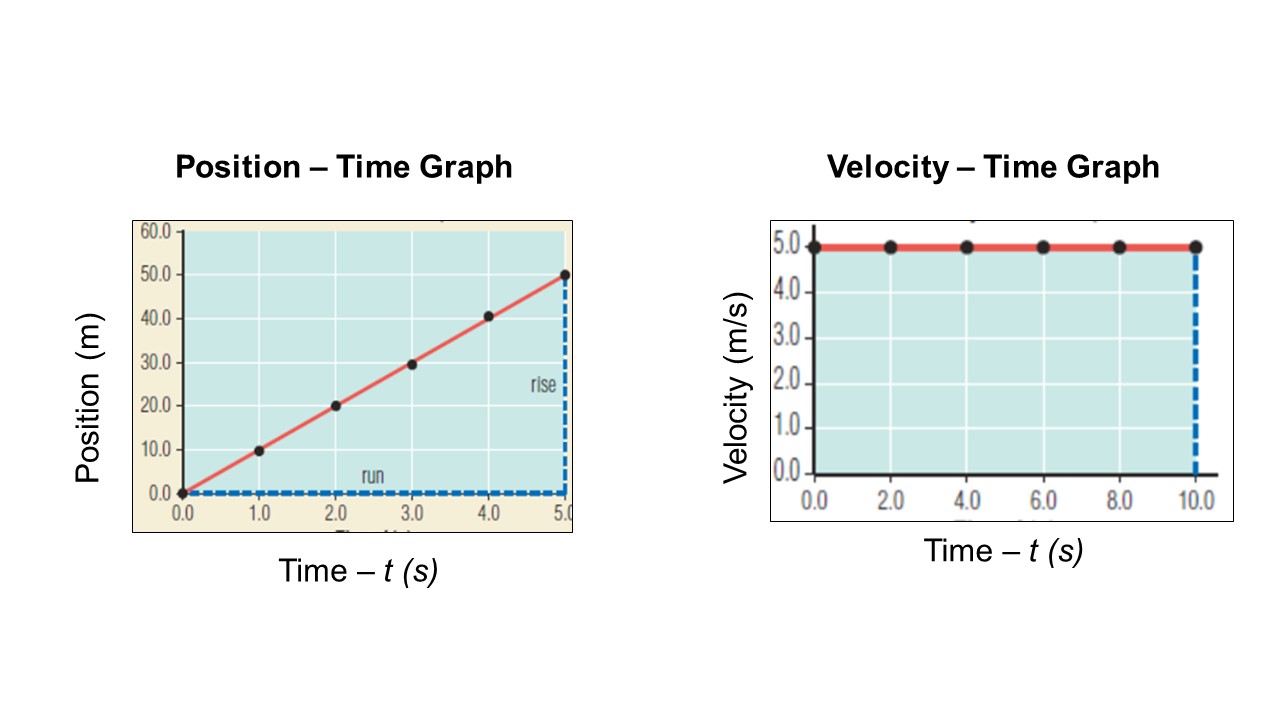
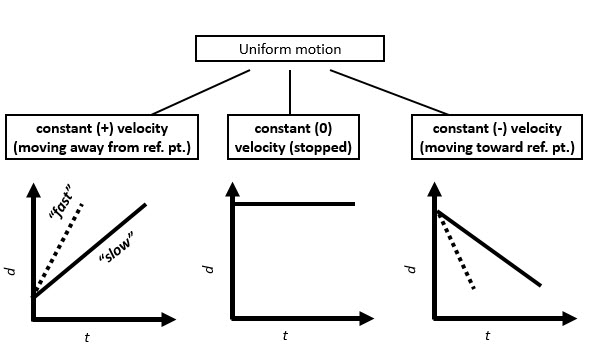
Summary of d-t graphs. The slope denotes the velocity
Summary of v-t graphs would look like this:
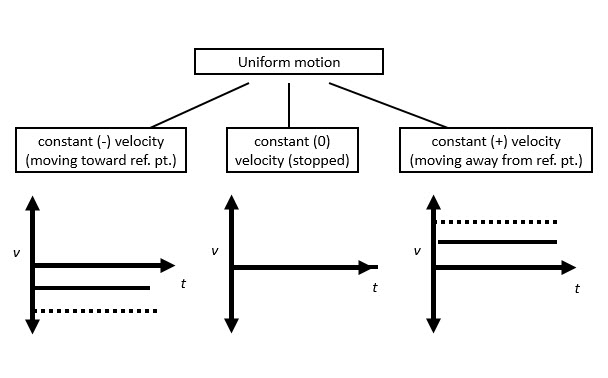
The y axis is replaced with v, which already accounts for the change in distance, therefore in uniform motion, no change in velocity with time, the graphs are represented as straight horizontal lines.
Non-Uniform Motion
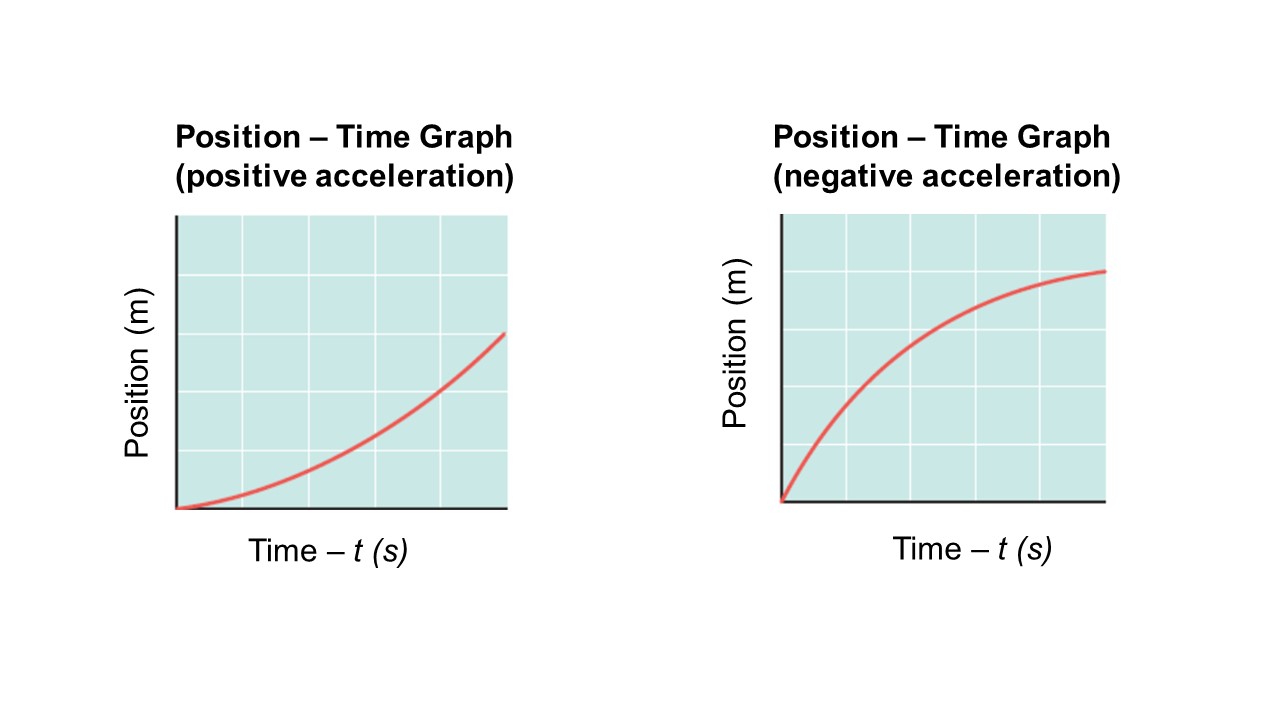
Position-Time Graphs
The slope of a position-time graph showing positive acceleration will be a curve with an increasing slope. The slope of a position-time graph showing negative acceleration will be a curve with decreasing slope.
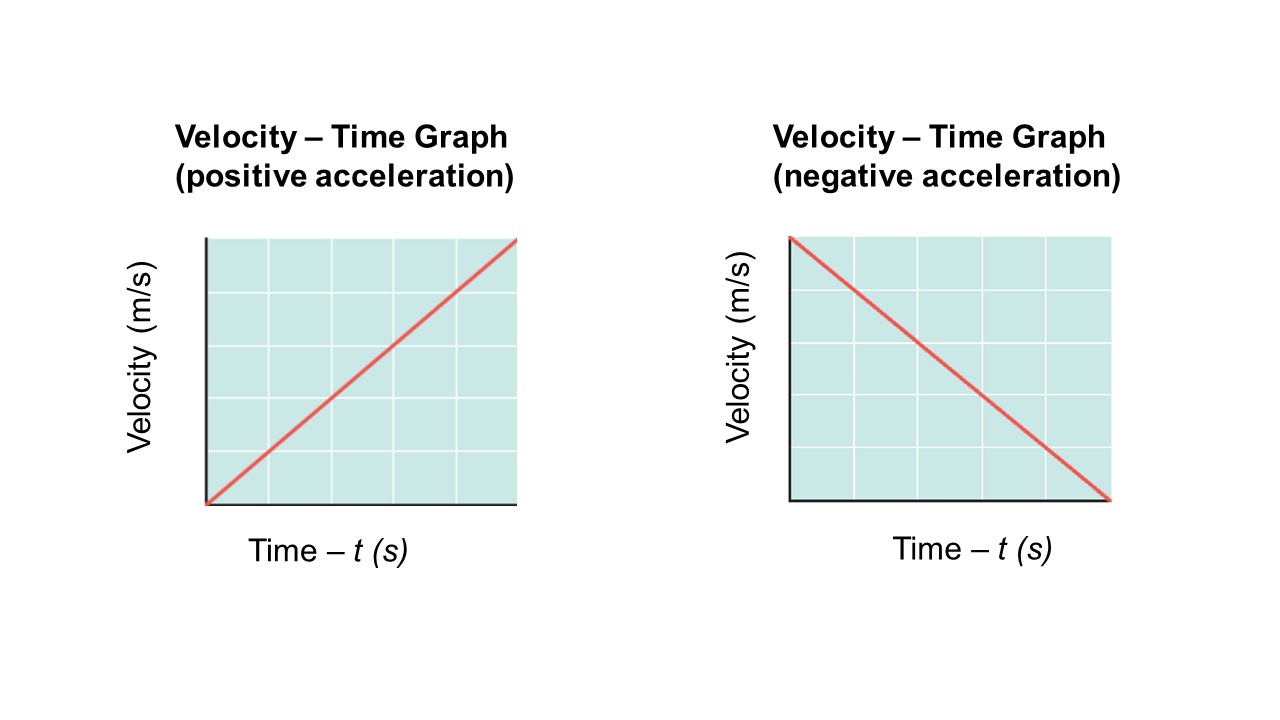
Velocity-Time Graphs
The slope of a velocity-time graph showing positive acceleration will be increasing. The slope of a velocity-time graph showing negative acceleration will be decreasing. The slope of a velocity-time graph is equal to the object’s acceleration. The area under the line is equal to the total displacement.
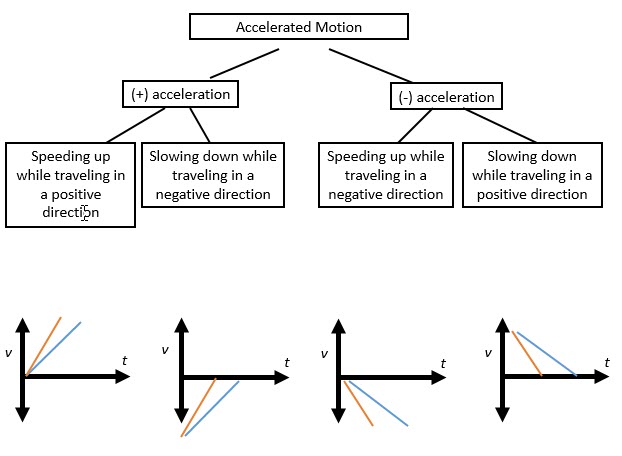
Acceleration
Acceleration (occurs in non-uniform motion) is the change in velocity in each time interval, it can be positive or negative. Acceleration is a vector quantity so both magnitude and direction must be given, unless otherwise indicated. If no direction is provided, make the assumption that the direction is positive.
Therefore, the slope of a v-t graph represents acceleration. The most common units for acceleration are m/s2.
The universally accepted average rate of vertical acceleration due to gravity (g) near the earth’s surface is 9.81 m/s2. All objects in free fall experience this acceleration if the effects of air resistance can be ignored.
V-t graphs are better at portraying acceleration as shown below.
Analyzing Motion
The area under a v-t graph is equal to the displacement of the object. For example, A cat jumps straight up and then falls to the ground again (see graph below). Calculate the height of the cat’s jump.
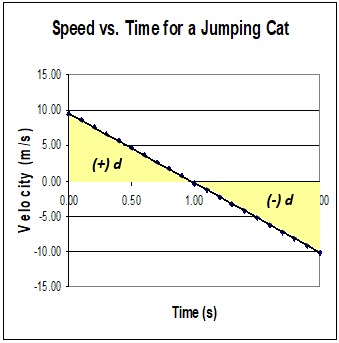
The area under the graph represents displacement.
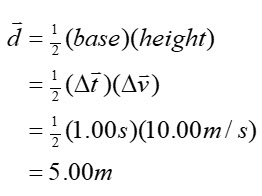
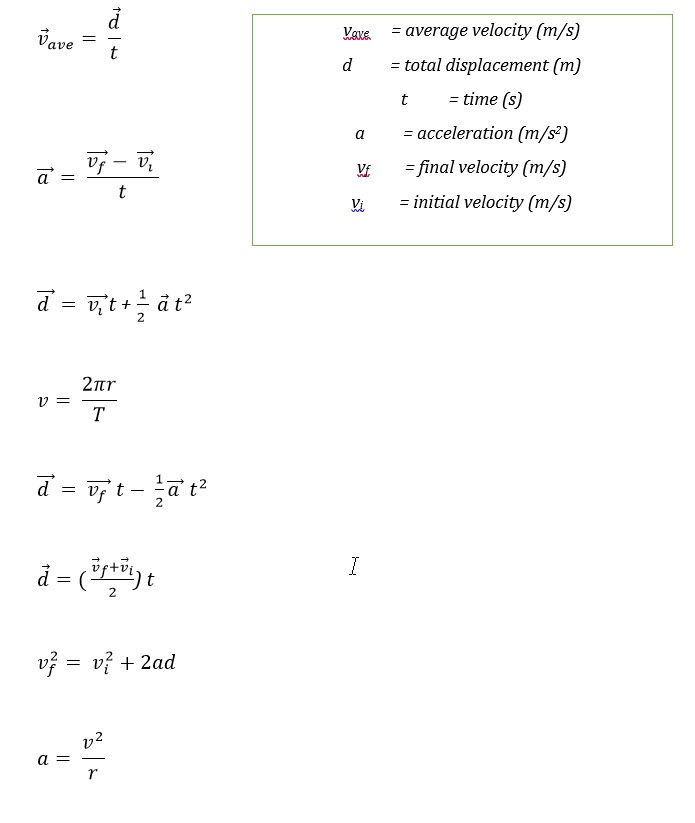
Some of the formulas you should know by now include: